Tracking the Moon’s Phases: A Practical Observer’s Guide to Lunar Influence Claims
The moon cycles through its phases every 29.5 days, moving from new moon to full moon and back again. Whether you’re testing claims about lunar effects on sleep, gardening by moon signs, or simply appreciating the night sky, accurate phase tracking forms the foundation of meaningful observation.
Tracking moon phases requires understanding the lunar cycle’s 29.5-day rhythm, using reliable tools like astronomy apps or almanacs, and maintaining consistent observation records. Accurate tracking helps you test lunar influence claims scientifically while deepening your connection to natural cycles. Simple methods like photo documentation and phase journals transform casual observation into meaningful data collection that can reveal patterns or debunk myths.
Understanding the Eight Moon Phases
The moon doesn’t simply switch between dark and bright. It transitions through eight distinct phases as Earth, moon, and sun shift positions.
The new moon appears invisible because the moon sits between Earth and the sun. The illuminated side faces away from us. Within a few days, a thin crescent emerges on the right side (in the Northern Hemisphere). This waxing crescent grows each night.
At first quarter, exactly half the moon appears lit. The term “quarter” refers to the moon’s position in its orbit, not its appearance. The waxing gibbous phase follows, with more than half visible but not yet full.
The full moon occurs when Earth sits between the sun and moon. The entire face glows because sunlight hits it directly from our perspective. Then the cycle reverses through waning gibbous, third quarter (or last quarter), and waning crescent before returning to new moon.
Each phase lasts roughly 3.7 days. The complete cycle averages 29.53 days, called a synodic month or lunar month.
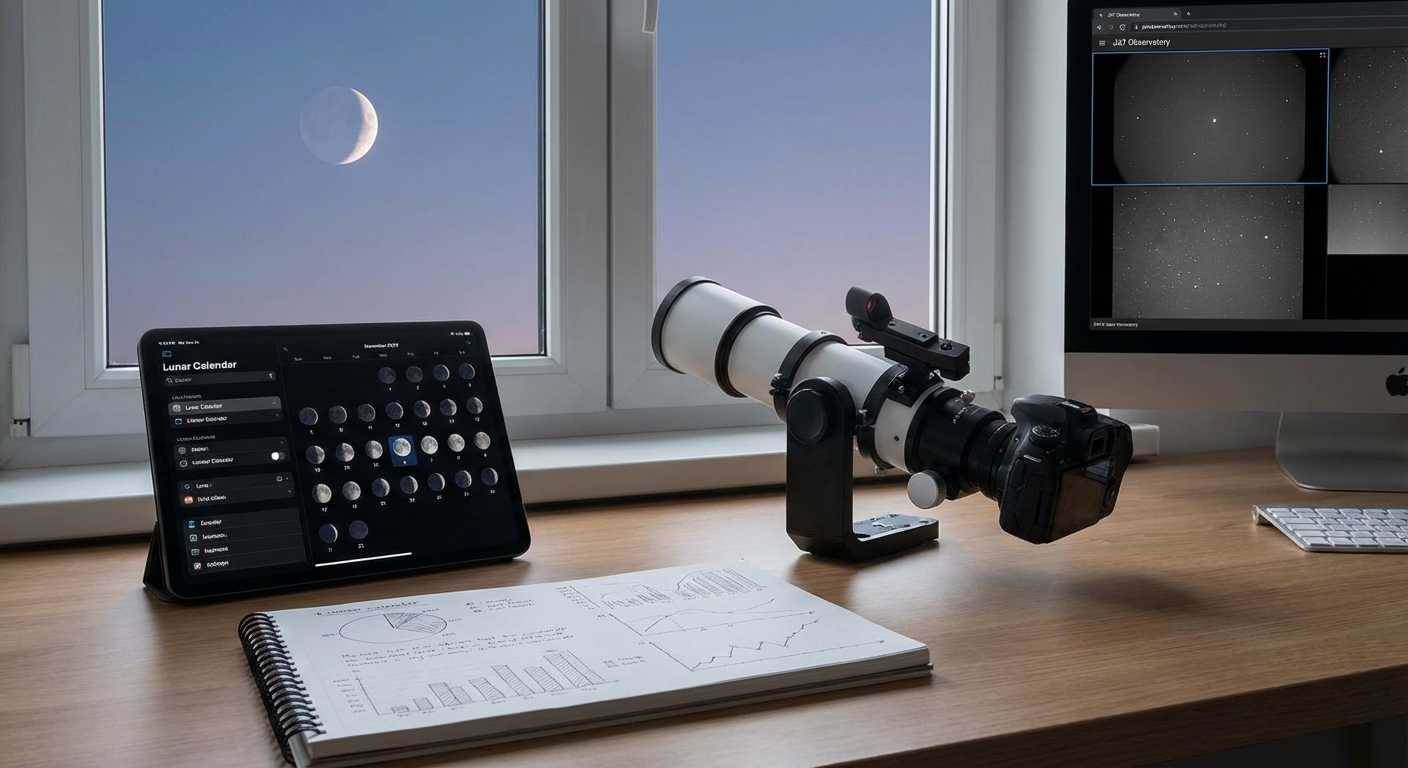
Setting Up Your Tracking System
You need three components for effective moon phase tracking: a reliable reference source, a recording method, and a consistent observation schedule.
Choose your primary reference tool:
- Smartphone astronomy apps (Sky Tonight, SkySafari, Star Walk 2)
- Printed almanacs or lunar calendars
- Online calculators from astronomy organizations
- Physical moon phase calendars
Apps provide real-time accuracy and automatic updates. They account for your exact location and time zone. Almanacs work without batteries or internet but require manual date checking.
Create your recording system:
Start with a dedicated notebook or digital document. Record the date, time, phase name, and visual appearance. Note the moon’s position in the sky (which constellation, how high above the horizon). Add weather conditions since clouds affect visibility.
Photography strengthens your records. Take a photo every clear night at the same time. Use a tripod for consistency. Even smartphone cameras capture enough detail to show phase progression.
Establish observation routines:
Pick a specific time each night, ideally after sunset when the moon becomes visible. Same-time observations reveal how the moon rises approximately 50 minutes later each day. This delay occurs because the moon orbits Earth while Earth rotates.
Tracking Methods for Different Goals
Your tracking approach depends on what you’re testing or observing.
For Testing Behavioral Claims
Claims about lunar effects on mood, sleep, or behavior require careful data collection. Track your target variable (sleep quality, energy levels, mood ratings) daily using a consistent scale. Record the moon phase separately. After collecting data for at least three complete lunar cycles (about 90 days), compare your measurements across phases.
Use a simple 1-10 scale for subjective measures. Note the time you record each measurement. Include potential confounding factors like caffeine intake, exercise, or stressful events.
For Gardening Applications
Garden-by-the-moon practitioners claim planting dates affect growth. Test this by splitting similar plants into groups. Plant one group during the recommended phase (often waxing moon for above-ground crops). Plant the control group during other phases. Track germination dates, growth rates, and yields.
Label each plant group clearly. Take weekly measurements. Photograph growth progression. Control other variables like water, sunlight, and soil quality.
For Astronomical Observation
Amateur astronomers track phases to plan observation sessions. The new moon offers the darkest skies for viewing faint objects. The full moon illuminates the landscape but washes out stars.
Create a monthly observation calendar. Mark optimal viewing nights for your targets. Note when the moon will interfere with your plans. Track cloud cover and seeing conditions alongside phases.
Common Tracking Mistakes and Solutions
| Mistake | Why It Happens | Solution |
|---|---|---|
| Confusing phase names | Similar terminology for different phases | Use reference images showing all eight phases |
| Ignoring time zones | Phase timing varies by location | Set your app or almanac to local time |
| Inconsistent observation times | Random checking creates gaps | Schedule daily reminders at the same time |
| Not accounting for weather | Clouds block visibility for days | Mark “clouded out” rather than skipping entries |
| Expecting instant patterns | Lunar cycles require multiple months to assess | Commit to 90+ days of tracking before drawing conclusions |
| Relying on memory | Recollection bias distorts data | Write everything down immediately |
The most significant error involves confirmation bias. People remember hits (times the moon phase seemed to correlate with an event) while forgetting misses. Your written records prevent this selective memory.
Building a Multi-Cycle Dataset
One lunar cycle proves nothing. Three cycles begin revealing patterns. Six cycles provide enough data for meaningful analysis.
Month 1: Learn the tracking routine. Get comfortable with phase identification. Establish your recording habits. Don’t worry about perfect data yet.
Months 2-3: Maintain consistency. Fill gaps from month one. Start noticing which phases you observe most easily and which you tend to miss.
Months 4-6: Your dataset now spans enough time to assess claims. Compare measurements across the same phases in different months. Look for consistent patterns or random variation.
“The difference between astronomy and astrology isn’t the observations themselves but how we interpret them. Both traditions track the same moon. Science demands that patterns repeat predictably across multiple cycles before accepting a connection.” — Dr. Phil Plait, astronomer and science communicator
Tools That Enhance Accuracy
Basic tracking requires only your eyes and a notebook. These additions improve precision and reveal details invisible to casual observation.
Binoculars transform moon viewing. Even a modest 7×50 pair shows craters, maria (dark plains), and the terminator line (the boundary between light and dark) in sharp detail. The terminator moves visibly across the surface, revealing topography through shadows.
A moon filter for telescopes reduces glare during bright phases. The full moon appears painfully bright through magnification. Yellow or neutral density filters preserve eye comfort while maintaining surface detail.
Red flashlights preserve night vision while you write notes. White light forces your eyes to readjust, wasting 20-30 minutes of dark adaptation. Clip a red LED light to your notebook.
Time-lapse photography captures the entire cycle in seconds. Set your camera to take one photo per night at sunset. Combine images into a video showing the complete phase progression. This visual record beats any written description.
Evaluating Lunar Influence Claims
Many traditions attribute effects to moon phases: better fishing during full moons, increased emergency room visits, higher birth rates, or enhanced plant growth. Rigorous tracking helps you assess these claims personally.
The scientific approach:
- Define the claim specifically (not “the moon affects mood” but “I feel more anxious during full moons”).
- Identify the measurable variable (daily anxiety rating on a 1-10 scale).
- Track both the moon phase and your variable for 90+ days.
- Analyze whether your variable changes predictably with phases.
- Consider alternative explanations for any patterns you find.
Most lunar effect claims fail controlled testing. The moon’s gravitational pull affects ocean tides but has negligible impact on human-sized water volumes. Your body contains about 40 liters of water. The moon’s tidal force on this amount equals a fraction of a mosquito’s weight.
Yet subjective experiences feel real. If you sleep worse during full moons, your tracking data either confirms or contradicts this perception. Perhaps you actually sleep worse three days before the full moon. Or maybe sleep quality correlates with work stress, not lunar phases. Data reveals the truth.
Connecting Phases to Sky Position
The moon’s phase determines when and where it appears. This relationship helps you predict visibility and explains why certain phases dominate different times of night.
The new moon rises with the sun and sets with it. You can’t see it because it’s up during daylight and down at night. The first quarter moon rises around noon and sets near midnight. It dominates the evening sky. The full moon rises at sunset and sets at sunrise, staying visible all night. The third quarter moon rises around midnight and remains visible through morning.
Understanding this pattern helps you plan observations. Want to photograph a waxing crescent? Look west just after sunset. Hoping to see the waning gibbous? Check the eastern sky before dawn.
The moon’s path across the sky also varies seasonally. Summer full moons stay low on the horizon (in the Northern Hemisphere). Winter full moons arc high overhead. This happens because the moon follows roughly the same path as the sun did six months earlier.
Advanced Tracking Considerations
Once basic phase tracking becomes routine, these refinements add depth to your observations.
Lunar libration causes the moon to wobble slightly, revealing about 59% of its surface over time instead of exactly 50%. Track which features appear near the edge during different cycles. Mare Orientale, normally hidden, occasionally peeks around the limb.
Supermoons and micromoons occur when full moons coincide with the moon’s closest or farthest orbital points. The size difference reaches 14%. Photograph these extremes from the same location for comparison. The effect looks more dramatic than it actually is due to the moon illusion (the moon appears larger near the horizon for psychological reasons, not optical ones).
Blue moons (the second full moon in a calendar month) happen every 2.7 years due to the mismatch between lunar months (29.5 days) and calendar months (30-31 days). Track these rarities in your long-term records.
Eclipse prediction becomes possible once you understand the lunar cycle. Eclipses only occur during full moons (lunar eclipses) or new moons (solar eclipses). Not every full or new moon produces an eclipse because the moon’s orbit tilts 5 degrees relative to Earth’s orbit around the sun.
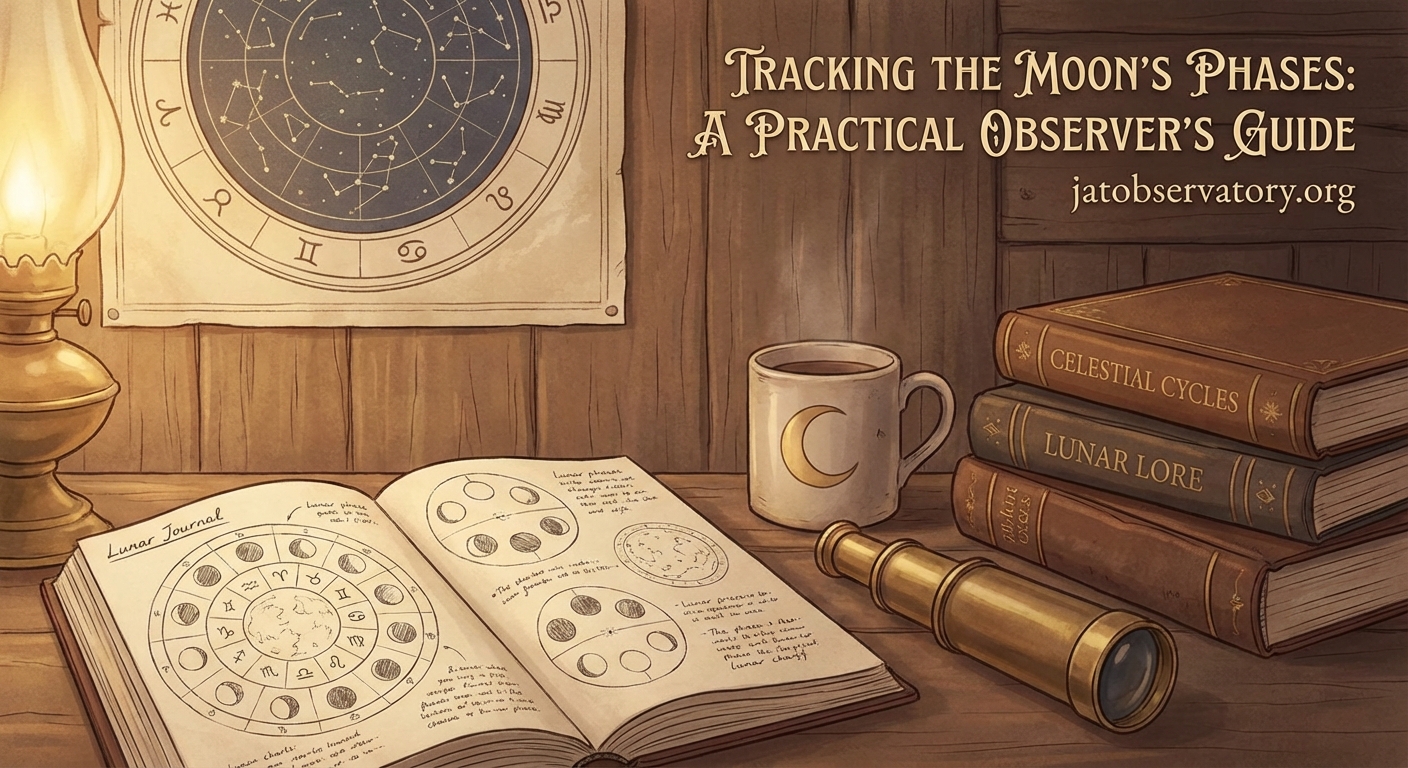
Creating Your Personal Lunar Journal
A well-maintained lunar journal becomes a valuable reference and a satisfying record of your observations.
Dedicate the first few pages to reference information: a diagram of the eight phases, a table of phase names in order, and notes about what you’re tracking and why. Include your location coordinates since they affect rise and set times.
For each entry, use a consistent format. Date and time come first. Phase name and approximate illumination percentage follow. Describe the moon’s appearance in your own words (color, clarity, visible features). Note the sky conditions (clear, hazy, partly cloudy). Record any measurements or observations related to claims you’re testing.
Leave space for monthly summaries. After each complete cycle, review your entries. Note patterns, surprises, or questions that emerged. Calculate any statistics if you’re testing specific claims.
Add sketches even if you’re not an artist. Simple circles showing the illuminated portion help you remember what you saw better than words alone. Draw major features like crater positions if you’re using optical aid.
Making Sense of Your Data
After three to six months of consistent tracking, patterns emerge or don’t. This reveals more than any single observation could.
Transfer your written observations into a spreadsheet or table. Create columns for date, phase, and whatever variables you’ve been measuring (sleep hours, garden growth, mood ratings). Sort by phase to group all full moon observations together, all new moon observations together, and so on.
Calculate averages for each phase. Does your sleep average 7.2 hours during full moons but 7.8 hours during new moons? That’s a measurable difference. But is it significant? A half-hour variation could result from random chance across a small sample.
Look for confounding variables. Did you travel during several full moons? Did a stressful work project coincide with a particular phase? Real patterns persist across multiple cycles despite these disruptions. Spurious correlations disappear when you control for other factors.
If you find no correlation between moon phases and your measured variable, that’s a valid and valuable result. You’ve tested a claim scientifically and found it wanting in your personal experience.
Sharing Observations and Learning from Others
Moon tracking connects you to a global community of observers stretching back millennia.
Online forums and social media groups dedicated to lunar observation provide spaces to share photos, ask questions, and compare notes. Amateur astronomy clubs often include moon observers. Local clubs host star parties where you can view through different telescopes and learn techniques from experienced watchers.
Contribute your observations to citizen science projects. Some organizations collect lunar photographs to create comprehensive maps. Others gather data about sky brightness or atmospheric conditions that affect lunar visibility.
Read historical accounts of lunar observation. Ancient astronomers tracked phases to create calendars. Their careful records, maintained over centuries, enabled prediction of eclipses and understanding of orbital mechanics. Your journal continues this tradition.
Your Moon, Your Data, Your Conclusions
Tracking moon phases transforms passive sky-gazing into active investigation. You gather evidence. You test claims. You develop observational skills that apply far beyond lunar studies.
The moon’s reliability makes it an ideal subject for long-term tracking. Unlike planets that wander or stars that only appear seasonally, the moon cycles predictably through the same phases month after month. This consistency lets you focus on developing good data collection habits without worrying about losing your target.
Whether you confirm or refute lunar influence claims, you’ll gain something more valuable than either outcome: direct experience with the scientific method. You’ll understand how to separate signal from noise, how to recognize your own biases, and how to let evidence guide your conclusions.
Start tonight. Note the current phase. Write it down. Tomorrow night, observe again. In three months, you’ll have a dataset. In six months, you’ll have answers.
Post Comment